
The electric vehicle industry is growing fast, and it’s expected to expand exponentially as the world adopts zero-emissions laws. Today’s charging infrastructure still has a long way to go.
Charging companies are trying to catch up with the increasing sales of electric vehicles (EVs). Meanwhile, governments are focusing on installing publicly available chargers.
We collected some of the most important statistics about EV charging stations worldwide, along with some additional EV statistics that will help you with strategic planning.
1. By the end of 2022, there are projected to be 2.8 million publicly available EV charging stations in the world, compared to 1.777 million in 2021 (Sources 1/2)
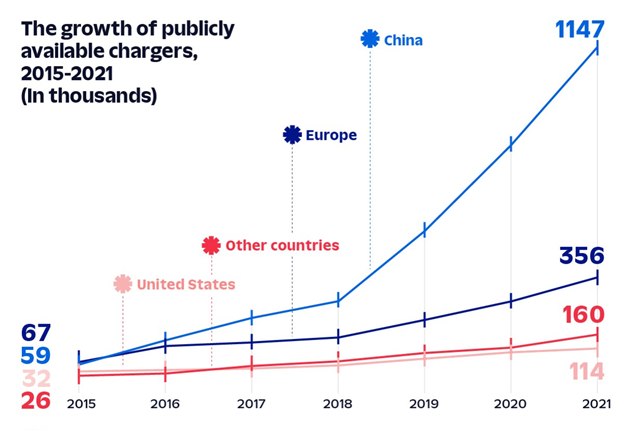
In 2021, there were 1,777,000 publicly available charging stations worldwide (1.2 million were publicly available slow chargers and 577,000 were publicly available fast chargers). That’s a steep rise in roughly a decade, as in 2010 there were only 310 publicly available fast EV charging stations and 3,700 publicly available slow EV charging stations globally.
Considering the growing demand and adoption of EVs, governments are coming up with ways to expand EV charger networks. For example, a large number of U.S. citizens live in condominiums and apartments that are not well-equipped for charging.
Therefore, experts are advising the U.S. government to adopt state policies to favor equitable charging, so underserved areas can have EV charging stations too.
This is crucial if countries want to maintain a healthy ratio of EVs to chargers. In 2021, the global ratio was 10 EVs per charger at 2.4 kW per EV.
However, most countries are making an active effort to ensure a smaller ratio. China alone is working to decrease the global average as their current ratio is 7 EVs per charger at 3.8 kW per EV.
2. According to projections, there will be a total of 12.9 million publicly available EV charging stations by 2030 charging at 1,400 amperes (Sources 1/2)
Of the total 12.9 million charging stations, 4.7 million will be fast EV charging stations and 8.2 million will be slow EV charging stations.
Projections show a steady increase in the total number of publicly available chargers. As for the U.S., data shows a sharp increment until 2025 to 540,000 chargers. After that, a slower escalation until 2030 with a total of 800,000 publicly available chargers. China remains at the top in the 2030 projections with 8.6 million publicly available chargers.
Today, EV charging times are limited because of the heat generated when electrical current is supplied to the vehicle batteries. The greater the current, the more heat is generated.
Faster charging times require the ability to cool conductors. Currently, fast charging systems use sizable conductors to provide 350 amperes of charging power, which can charge EVs in 20 minutes. However, the cables are bulkier in this case.
To reduce charging times to 5 minutes, a current at 1,400 amperes is required. However, NASA’s Flow Boiling and Condensation Experiments (FBCE) may help reach that kind of power by offering a better cooling solution.
Scientists at NASA were able to reach 2,400 amperes while experimenting with this new cooling technology on EV charging cables.
However, such technology takes years for widespread implementation. But considering Wright’s Law, ultra-fast publicly available chargers will be common globally by 2030.
3. China has the highest number of publicly available charging stations at 1.15 million, almost 8 times higher than its counterparts (Source)
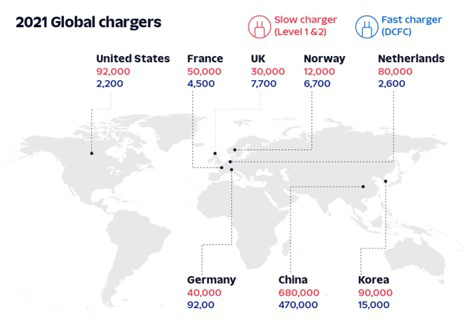
As of January 2022, China has 470,000 publicly available fast EV charging stations and 680,000 slow EV charging stations.
China has been at the forefront of the EV revolution for a while. China and India are the two countries that are expected to double down on increasing publicly available EV chargers after 2025.
In 2020, China had a total of 810,000 EV chargers. By 2030, China is projected to have 8.6 million publicly available chargers. That’s almost 67% of the world’s projected total publicly available EV chargers in 2030.
However, current projections are based on the Stated Policies Scenario. It’s possible that announced policies may lead to even greater adoption of EVs throughout the country.
Considering that half of the world’s EV sales are in China, the country needs to keep up with the growing demand for chargers. Almost a quarter of all newly registered cars in China are EVs or plug-in hybrids.
The BBC reports that some electric taxis in Beijing and a few other major cities go to battery-swapping stations instead of charging their EVs. Battery swapping requires a few minutes while charging EVs can take up to 2 hours, including wait times.
Therefore, China is pushing to drastically increase the total number of publicly available EV chargers, especially fast chargers.
4. In 2021, 60% of all EV charging stations in the U.S. were Tesla Superchargers, but China still had 85% of the world’s fast charger stations (Source)
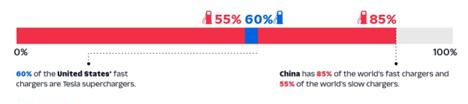
China also has 55% of the world’s slow chargers. Europe was in second place with 25% of the world’s slow EV chargers, followed by the U.S. with 8% of global slow EV chargers.
When it comes to fast chargers, Europe comes in second place with 9% of the world’s fast EV chargers, followed by the U.S. with 4% of global fast chargers.
Moving forward, most countries are making an effort to increase fast EV chargers. The pandemic slowed the deployment of publicly accessible chargers. For context, the growth rate of publicly accessible chargers was 45% at the start of 2020. However, by the end of 2021 it was 37%.
However, the growth rate of fast charging was higher in 2021 at 48%, compared to 43% in 2021. On the other hand, the slow charging growth rate was 33% in 2021, compared to 46% in 2020.
Currently, Norway and the U.S. require a higher growth rate of EV chargers. That’s because Norway currently has the highest EV per charging point ratio at 33.6 EV, followed by the U.S. at 18.2 EV per charging point.
5. The number of publicly accessible chargers in Europe increased 30% in 2021 for both slow and fast EV charging stations (Source)
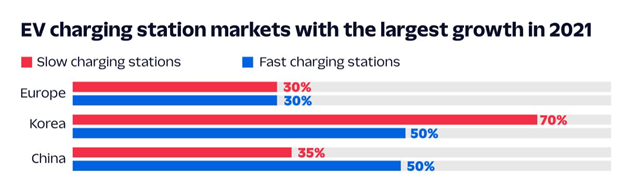 In 2021, the European, Korean, and Chinese EV markets saw the most growth.
Within Europe, the Netherlands leads in slow chargers with more than 80,000 publicly available nationally. France takes second place with 50,000, followed by 40,000 in Germany, 30,000 in the United Kingdom, 20,000 in Italy, and 12,000 in both Sweden and Norway.
The total number of publicly available fast chargers in Europe reached 50,000 units at the start of 2022. Out of those 50,000, 9,200 were in Germany, 7,700 in the United Kingdom, 6,700 in Norway, 4,500 in France, and 2,600 in Spain and the Netherlands.
In comparison, the U.S. had 22,000 fast chargers, 60% of which were Tesla Superchargers.
6. By the end of 2022, EV sales are expected to reach 10.6 million in the world—almost 3 times more than in 2018 (Source)
In the first quarter of 2022, more than 2 million EVs were sold. This is a 75% increase from Q1 2021.
As EV sales increase at an exponential rate, the demand for EV charging stations is also increasing, especially for fast chargers. That is why countries like China and the U.S. are making an effort to increase the growth rate of publicly available fast chargers.
By 2025, EV sales are projected to reach 15.9 million, and by 2030 that number is projected to reach 27.7 million.
Today, 1 in 2 EV sales happens in China. However, that is expected to change moving forward. By 2025, China is expected to have 7.5 million EV sales, which is 47% of the global projection. By 2030, they’re projected to have 11 million EV sales, almost 40% of the global total.
7. As of 2022, the ChargePoint Network is the biggest network of EV chargers in the U.S. with 15,454 locations and 48,946 charging points (Source)
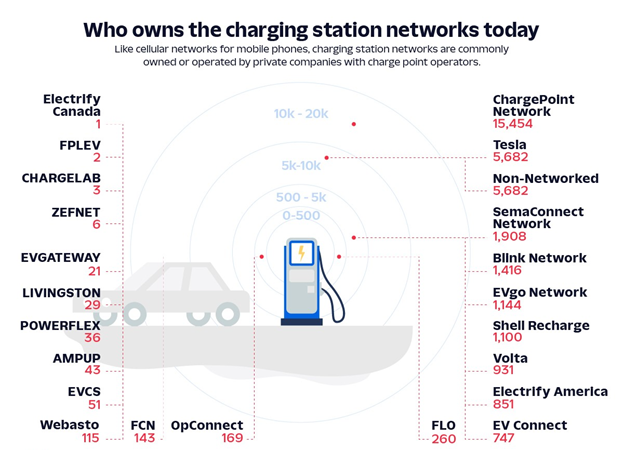 The ChargePoint Network is followed by Tesla which has 5,682 locations and 27,257 charging points in the U.S.
The ChargePoint Network has 152 level-1 locations and 157 level-1 ports. They also have 14,155 level-2 locations and 47,114 level-2 ports. Furthermore, they have 1,147 direct-current fast charger (DCFC) locations and 1,675 DCFC ports.
DCFC ports are the fastest EV chargers, followed by level 2 and level 1 ports which are considered slow chargers.
In comparison, Tesla does not have any level 1 chargers. However, they have 4,436 level-2 locations with 14,677 level-2 ports. Meanwhile, they have 1,246 DCFC locations, also known as Tesla Superchargers, with 12,580 DCFC ports.
8. The global EV charging station market is currently worth $18.22 billion (Source)
The market has a 35% CAGR, projecting that the market will be worth $115 billion in 2028.
According to the research, the EV market is primarily driven by the continuous reduction in EV operating costs, compared to traditional gas vehicles. A downward trend in the price of lithium-ion batteries is another factor.
Furthermore, as the commercial applications of EVs become commonplace, it will lead to a drastic increase in the demand for EV charging services.
On top of that, the demand for fast charging stations and next-generation EV chargers is also bound to increase the EV charging market’s worth.
9. It takes an average of 1 hour and 17 minutes for an EV to fully charge at a public charging station (Source)
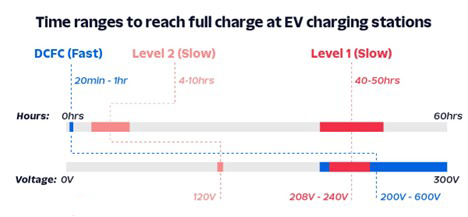 There are three different levels of charging speeds based on different versions of EV chargers.
The current electric range per hour of charging for DCFCs is between 180-240 miles. In comparison, level 1 and 2 chargers have a range of 2-5 miles and 10-20 miles, respectively.
10. By 2030, the global lithium-ion automotive battery manufacturing capacity is expected to reach 3.2 TWh, compared to 300 GWh in 2021 (Source)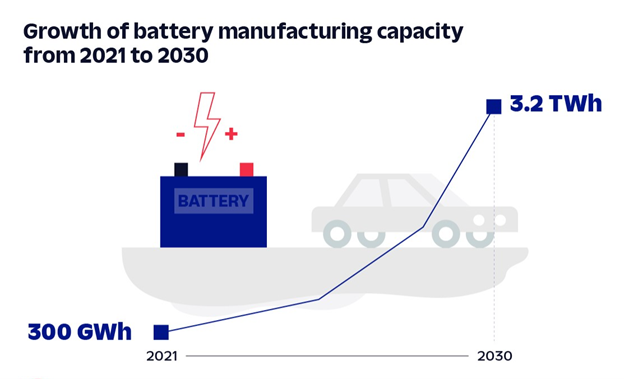
The actual production came to around 160 GWh in 2021, which means companies are prepared for a sharp increase in EVs on the road.
According to the Stated Policies Scenario, by 2025 the battery manufacturing capacity is expected to reach 0.6 terawatt-hours (TWh) of electricity. However, the Sustainable Development Scenario puts that number at 1.1 TWh.
Similarly, the Sustainable Development Scenario puts the 2030 projection at 3.2 TWh while the Stated Policies Scenario puts it at 1.6 TWh in 2030.
One of the largest customer experience shifts of this decade will involve the transition from refueling vehicles at gas stations to EV charging stations. This shift will transform “pay at the pump”, as consumers switch from a transactional refueling experience to a relationship with a Charge Point Operator.
CPOs are faced with combining compliant charging infrastructure and the customer charging experience (apps, charging performance, billing, and customer service). Providers who emerge as winners in this hyper-competitive environment will serve customers with availability, reliability, and a personalized experience.
This desire to differentiate, both on the hardware and infrastructure side, and on the customer experience and engagement side, calls for the integration of various existing and emerging technologies. Unified platforms like the KORE platform are here to help. Want to learn more? Reach out!
U3GM Blog Post Comments